REFERENCE
- Gallery page: https://magpui.com/en/i/contribution-graph-becomes-a-skyline-e80334
- First frame (image): https://dnioievkvxejjbxgwvko.supabase.co/storage/v1/object/public/media/contribution-graph-becomes-a-skyline-e80334/shot.jpg
- Clip (mp4): https://dnioievkvxejjbxgwvko.supabase.co/storage/v1/object/public/media/contribution-graph-becomes-a-skyline-e80334/clip.mp4
- Original post: https://x.com/desdivj/status/2118290722889908705 by @desdivj
Before building, download the first frame and look at it. If ffmpeg is available, download the clip and extract frames (ffmpeg -i clip.mp4 -vf fps=2 frame-%02d.png), then study the motion frame by frame. Match what you see; the text below describes it, the frames are the truth.

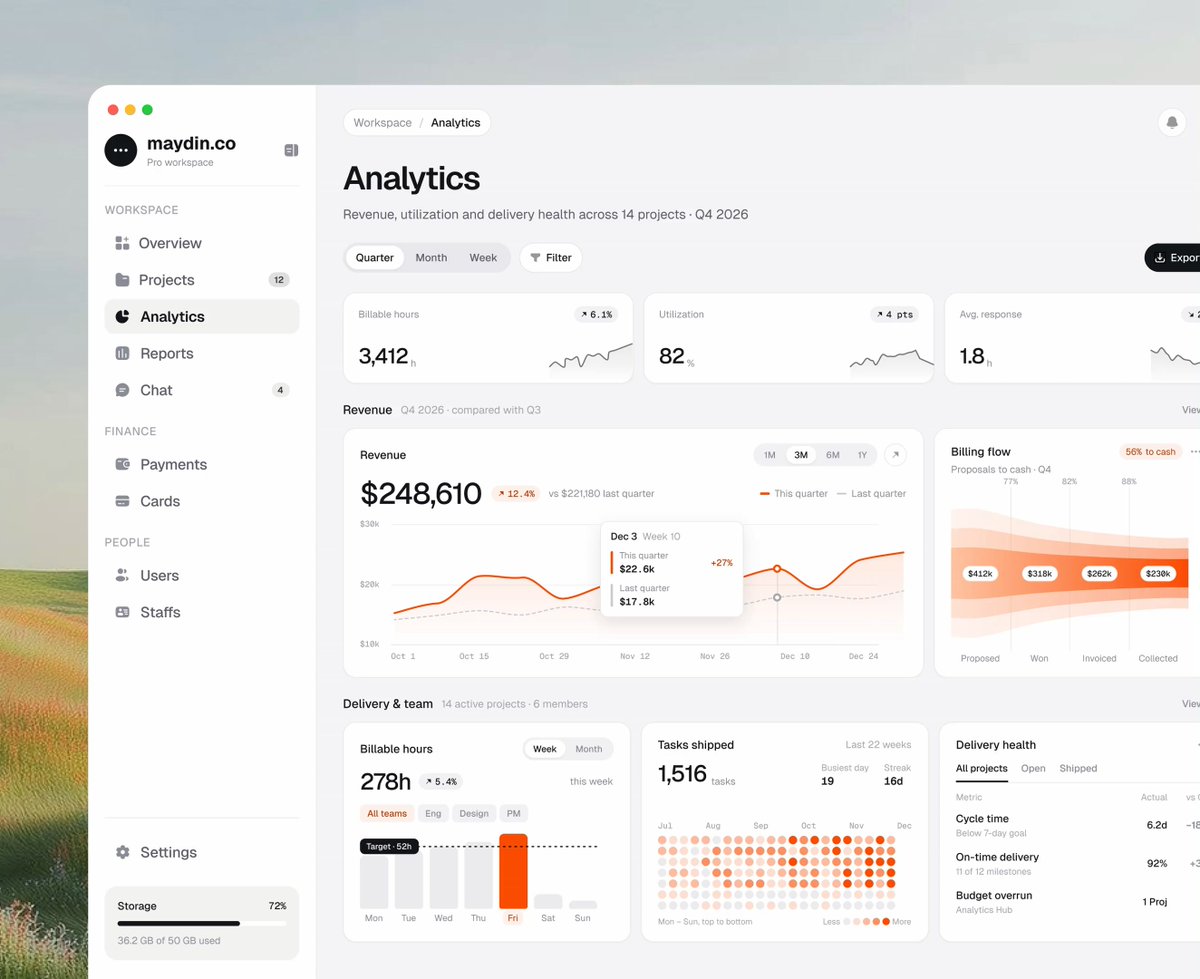
BUILD: Build a light SaaS analytics card called Tasks shipped. Idle state is a GitHub-style contribution heatmap of ~22 weeks as a grid of soft circular dots (near-white to deep orange). Clicking or expanding the card slides in a taller detail panel where the same data rises into an isometric skyline: the busiest days become tall orange towers on a perspective floor, quieter days stay as low pads or dots. A dark tooltip on hover names the weekday and task count and lists 2–3 project chips. Feel: a flat contribution graph that quietly becomes a miniature city.

DESIGN SYSTEM: Card on white #ffffff over soft gray #f4f4f5, radius 16–20px, hairline border #e5e7eb, soft shadow 0 8px 24px rgba(15,23,42,0.06). Accent orange ~#f97316 to deep #ea580c for intensity. Typography: clean sans (Inter/Geist), title 14–15px medium #0a0a0a, big count ~28–32px semibold tabular, muted labels 12px #737373. Heatmap dots ~8–10px circles, 4–6px gap, 7 rows (weekdays) × ~22 cols. Detail panel width ~320–360px, same radius, slides from the right of the card. Skyline: isometric orange boxes with slight top face highlight (#fb923c) and soft ground grid.

MOTION: Expand: panel slides in 320–380ms cubic-bezier(0.22,1,0.36,1), backdrop content eases 8–12px left. Skyline rise: each tower grows from its heatmap cell height 0→full over 500–700ms with 18–28ms stagger left-to-right then back-to-front, easing cubic-bezier(0.16,1,0.3,1). Tooltip: fade+4px rise in 120ms. Collapse reverses in ~280ms.

SECTIONS: (1) Header row — title Tasks shipped, total count, Busiest day + Streak chips. (2) Heatmap grid — intensity-mapped dots, hover highlights one cell. (3) Expanded panel — isometric skyline of the same series, weekday rhythm mini bars, optional team list with avatars. States: idle heatmap, hover cell, expanded skyline, tooltip open.

IMPLEMENTATION: React + CSS 3D (transform: rotateX/rotateZ) or Motion for the rise; SVG/Canvas fine for dots. Avoid heavy WebGL. prefers-reduced-motion: skip rise, swap to a static 2D bar chart. Keyboard: Enter/Space toggles expand, Esc closes, arrow keys move the highlighted cell. Cap towers at ~40 DOM nodes or draw skyline on one canvas.

ADAPT TO THE PROJECT: Reuse the project's tokens, card, tooltip and avatar components; map orange to the closest brand accent; never copy logos, product names, photos or real people from the original—use placeholders.

SUCCESS CHECK:
- Heatmap reads as a contribution graph with clear intensity steps.
- Expanding grows the densest days into an isometric skyline with staggered rise.
- Hover tooltip shows weekday, count and project chips without layout jump.