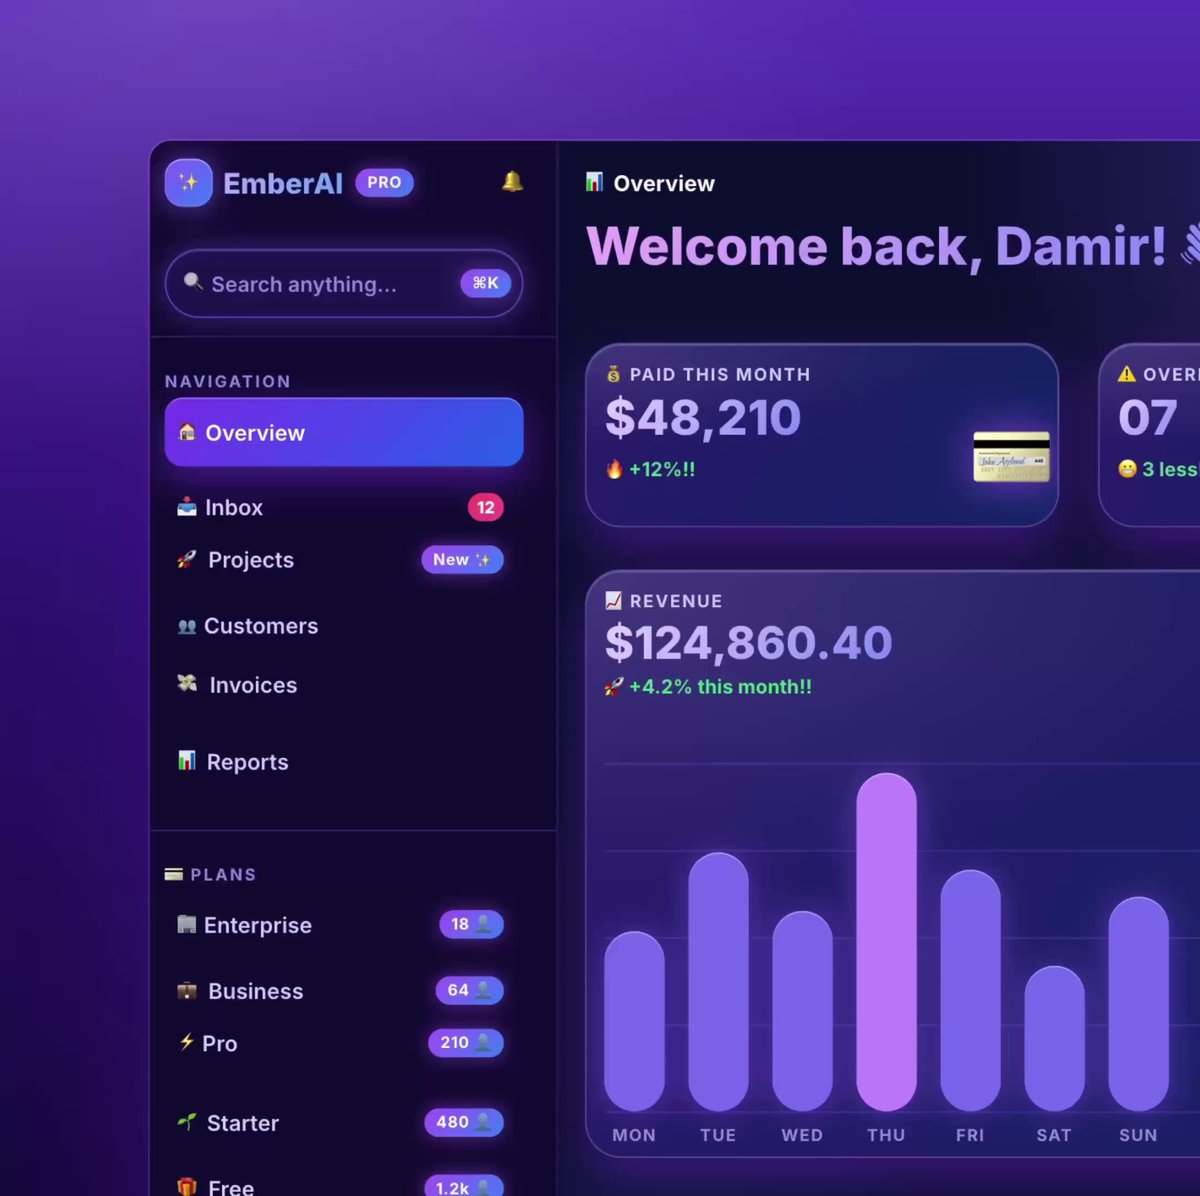
REFERENCE
- Gallery page: https://magpui.com/en/i/dark-finance-dashboard-unslopped-f6e6f0
- First frame (image): https://dnioievkvxejjbxgwvko.supabase.co/storage/v1/object/public/media/dark-finance-dashboard-unslopped-f6e6f0/shot.jpg
- Clip (mp4): https://dnioievkvxejjbxgwvko.supabase.co/storage/v1/object/public/media/dark-finance-dashboard-unslopped-f6e6f0/clip.mp4
- Original post: https://x.com/heydamir/status/2115063463063998736 by @heydamir
Before building, download the first frame and look at it. If ffmpeg is available, download the clip and extract frames (ffmpeg -i clip.mp4 -vf fps=2 frame-%02d.png), then study the motion frame by frame. Match what you see; the text below describes it, the frames are the truth.

BUILD: Build a calm, dark finance dashboard overview that looks hand-designed rather than generated: a left sidebar with navigation and plan counts, and a main area with a date heading, two metric cards and a revenue card with a layered wave chart. The look is near-black and restrained, with one clear hierarchy, no gradients on surfaces, no emoji, and a single family of quiet accents used only in the chart and plan dots.

DESIGN SYSTEM: Grid: sidebar 240px fixed, main content with 32px padding, 16px gaps between cards, everything on an 8px spacing scale (use 8, 12, 16, 24, 32 only). Background #0b0b0c, sidebar #0f0f10 separated by a 1px #1c1c1f border, cards #141416 with 1px #222226 border and radius 14px, no glow shadows. Typography: one neutral grotesque sans; page heading 28px weight 500 with the year in #6b6b70 (e.g. "October" white + "2026" grey); card labels 12px #8a8a90; metric numbers 26px weight 500 tabular figures, white; deltas 11px green #4ade80 with a muted suffix "vs last month"; nav items 13px #a1a1a6, active item on a #1c1c1f pill with white text and 8px radius. Icons 16px outline, 1.5px stroke, all from one set. Plan list in the sidebar: colored 6px dots (lime #c4f25c, blue #60a5fa, violet #a78bfa, pink #f472b6, grey #71717a) + name + right-aligned count in mono 12px #71717a. Search field 32px high with a small kbd hint. A small dark payment-card illustration (two overlapping cards, slight 3D tilt) inside the paid-this-month card.

MOTION: (1) Page load: cards fade and rise 8px, 400ms, cubic-bezier(0.22, 1, 0.36, 1), stagger 60ms. (2) Revenue chart: each wave (3-4 stacked bell-shaped curves in lime, blue, violet and pink, 1.5px strokes with a faint mirrored reflection below the baseline in 20% opacity) draws from left to right with stroke-dashoffset over 900ms, stagger 120ms. (3) Metric numbers count up over 700ms with ease-out. (4) Hover on a nav item: background fades in 150ms; hover on the chart shows a thin vertical guide and a small tooltip card.

SECTIONS: Sidebar: logo mark + product name and a collapse icon, search, Navigation (Overview active, Inbox with count, Projects, Customers, Invoices, Reports with chevrons where they expand), Plans list with counts. Main: header (breadcrumb icon + "Overview"), large month heading, row of metric cards (Paid this month with value, delta and card illustration; Overdue with count and a small warning label), Revenue card with value, delta, y-axis labels (0 to 150K) and x-axis months, layered wave chart. States: default, hover, loading skeleton, empty data.

IMPLEMENTATION: React + Tailwind (or the project's CSS system) with Motion for entrance and count-up; the chart in plain SVG (cubic bezier paths generated from data) or a light chart library styled to match, no default chart themes. Keep all colors as tokens so a light theme is possible. Keyboard focus visible on all nav items and the search field; chart values also available as an accessible table or aria-label. prefers-reduced-motion: no draw-on or count-up, render final state.

ADAPT TO THE PROJECT: Reuse the project's existing design tokens, components and fonts, map colors to the closest existing tokens, and never copy logos, brand names, photos or illustrations from the original; use placeholders.

SUCCESS CHECK:
- Every gap and padding is a value from the 8px scale, and card borders, radii and label sizes are identical across cards.
- The revenue waves draw in left to right with a stagger and a faint reflection below the baseline.
- No purple gradients, glows or emoji remain; the only color comes from the chart lines, plan dots and deltas.