REFERENCE
- Gallery page: https://magpui.com/en/i/pl-revenue-flow-sankey-card-a215a7
- First frame (image): https://dnioievkvxejjbxgwvko.supabase.co/storage/v1/object/public/media/pl-revenue-flow-sankey-card-a215a7/shot.jpg
- Clip (mp4): https://dnioievkvxejjbxgwvko.supabase.co/storage/v1/object/public/media/pl-revenue-flow-sankey-card-a215a7/clip.mp4
- Original post: https://x.com/FaizalSukaimi/status/2117236761080566247 by @FaizalSukaimi
Before building, download the first frame and look at it. If ffmpeg is available, download the clip and extract frames (ffmpeg -i clip.mp4 -vf fps=2 frame-%02d.png), then study the motion frame by frame. Match what you see; the text below describes it, the frames are the truth.

BUILD
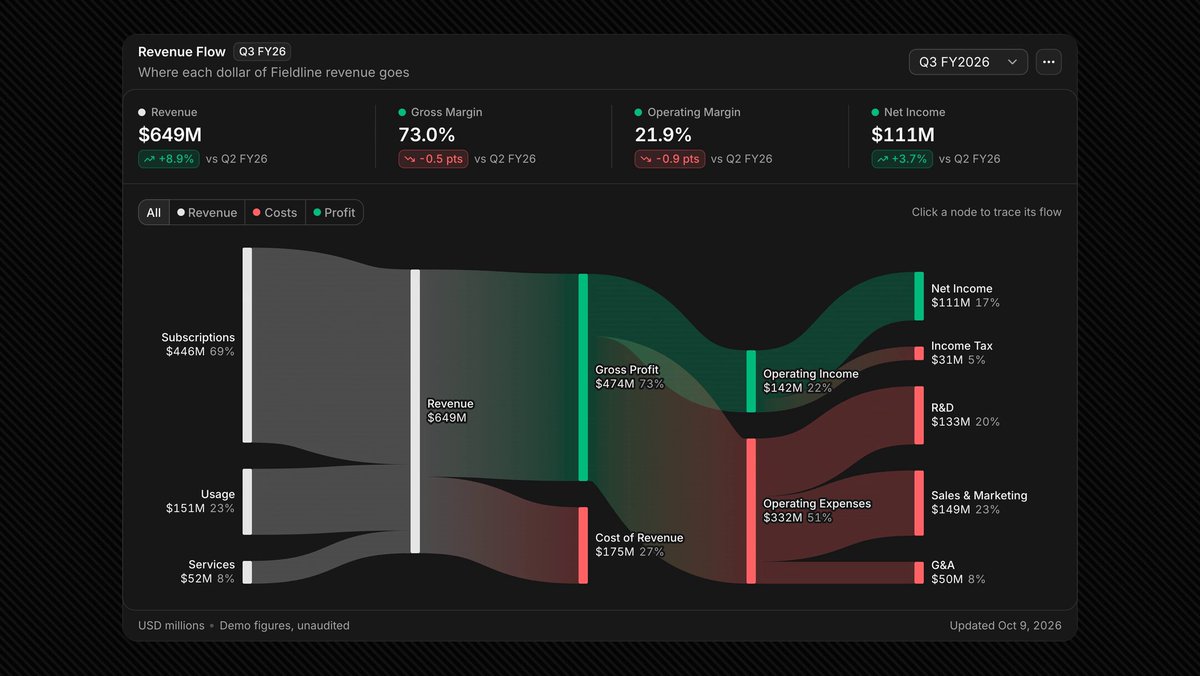
A single dashboard card titled "Revenue Flow" that explains where each dollar of revenue goes in one quarter, as a left-to-right Sankey chart: three revenue sources (subscriptions, usage, services) merge into total revenue, which splits into gross profit and cost of revenue; gross profit splits into operating income and operating expenses; those end in net income, income tax and expense lines (R&D, sales & marketing, G&A). Hovering highlights a path, clicking a node pins it, the quarter can be switched and the data exported. It should feel calm, precise and readable, like a finance tool built with shadcn/ui.

DESIGN SYSTEM
- Card: 1040px wide max, background #1A1A1A, 1px border #2A2A2A, radius 14px, inner sections separated by 1px #262626 rules. Page background #0F0F0F.
- Header: title 15px semibold #F2F2F2 + a small outlined badge ("Q3 FY26", 11px, radius 6px), subtitle 13px #9A9A9A; right side a quarter select (outlined, 32px tall, radius 8px) and a 32px icon button with a more menu.
- KPI row: 4 equal columns with vertical dividers; label 12px #A3A3A3 with a 6px colored dot (white revenue, green margins, green net income), value 22px semibold tabular numbers #FAFAFA, delta chip (11px, radius 5px, green #16A34A on rgba(22,163,74,0.12) or red #DC2626 on rgba(220,38,38,0.12)) with a trend icon plus "vs Q2 FY26" muted.
- Chart area: 360px tall, 24px padding; a segmented legend filter at top-left (All · Revenue · Costs · Profit, 12px, active segment filled #2A2A2A) and, when a node is pinned, a removable chip top-right ("Gross Profit ×").
- Nodes: 10px wide bars; revenue nodes #E5E5E5, profit nodes #22C55E, cost nodes #F87171. Links: horizontal gradient from the source color to the target color at 35% opacity; labels 12px #D4D4D4 with the value and share in #8A8A8A.
- Footer: 12px muted "USD millions · Demo figures, unaudited" left, "Updated ..." right.

MOTION
- Mount: links grow from left to right by animating a clip-path rect width 0 -> 100% over 900ms cubic-bezier(.22,1,.36,1), nodes fade in with a 40ms stagger per column.
- Hover a link or node: the full upstream and downstream path stays at 85% opacity, everything else dims to 12% over 180ms ease-out; a tooltip (dark #0B0B0B, 1px #333 border, radius 8px, 12px text) shows source → target, flow value, share of source and share of revenue, following the cursor with a 12px offset.
- Click a node: pin the highlighted path (dashed 1px outline around the node) and show the removable chip; Escape or the chip's × unpins.
- Legend filter: non-matching links fade to 10% in 200ms.
- Quarter switch: node heights and link paths tween to the new values over 600ms cubic-bezier(.4,0,.2,1); KPI numbers count to new values in 500ms.

SECTIONS
1. Header (title, badge, subtitle, quarter select, more menu with Export CSV).
2. KPI row (revenue, gross margin, operating margin, net income) with deltas.
3. Chart with legend filter, pinned chip, nodes, links and tooltip.
4. Footer notes.
States: idle, hover path, pinned path, filtered, loading (skeleton bars), empty quarter.

IMPLEMENTATION
- React with d3-sankey for layout (or Recharts Sankey with custom node and link renderers) rendered as SVG, linearGradient per link; Motion or d3-transition for tweens. Keep data as nodes + links arrays and derive shares.
- Accessibility: nodes are focusable (tabindex 0, aria-label with name, value and share), Enter pins, arrow keys move between nodes; tooltip content also appears for focus; legend is a radiogroup.
- prefers-reduced-motion: no grow-in or tweens, instant highlight changes.
- Performance: under 30 links, memoize the layout, update only opacity on hover.

ADAPT TO THE PROJECT
Reuse the project's card, select, badge, button and tooltip components and its chart color tokens; map green and red to the existing success and destructive tokens. Do not copy the company name or figures; use placeholder data.

SUCCESS CHECK
- Hovering any link highlights its full path from revenue source to final line and shows a tooltip with flow and both shares.
- Clicking a node pins its path with a removable chip; Escape clears it.
- Switching quarter animates node heights, links and KPI values to the new data.