REFERENCE
- Gallery page: https://magpui.com/en/i/draggable-dot-matrix-caffeine-curve-f5e427
- First frame (image): https://dnioievkvxejjbxgwvko.supabase.co/storage/v1/object/public/media/draggable-dot-matrix-caffeine-curve-f5e427/shot.jpg
- Clip (mp4): https://dnioievkvxejjbxgwvko.supabase.co/storage/v1/object/public/media/draggable-dot-matrix-caffeine-curve-f5e427/clip.mp4
- Original post: https://x.com/PostiauxCharles/status/2119801461278146758 by @PostiauxCharles
Before building, download the first frame and look at it. If ffmpeg is available, download the clip and extract frames (ffmpeg -i clip.mp4 -vf fps=2 frame-%02d.png), then study the motion frame by frame. Match what you see; the text below describes it, the frames are the truth.

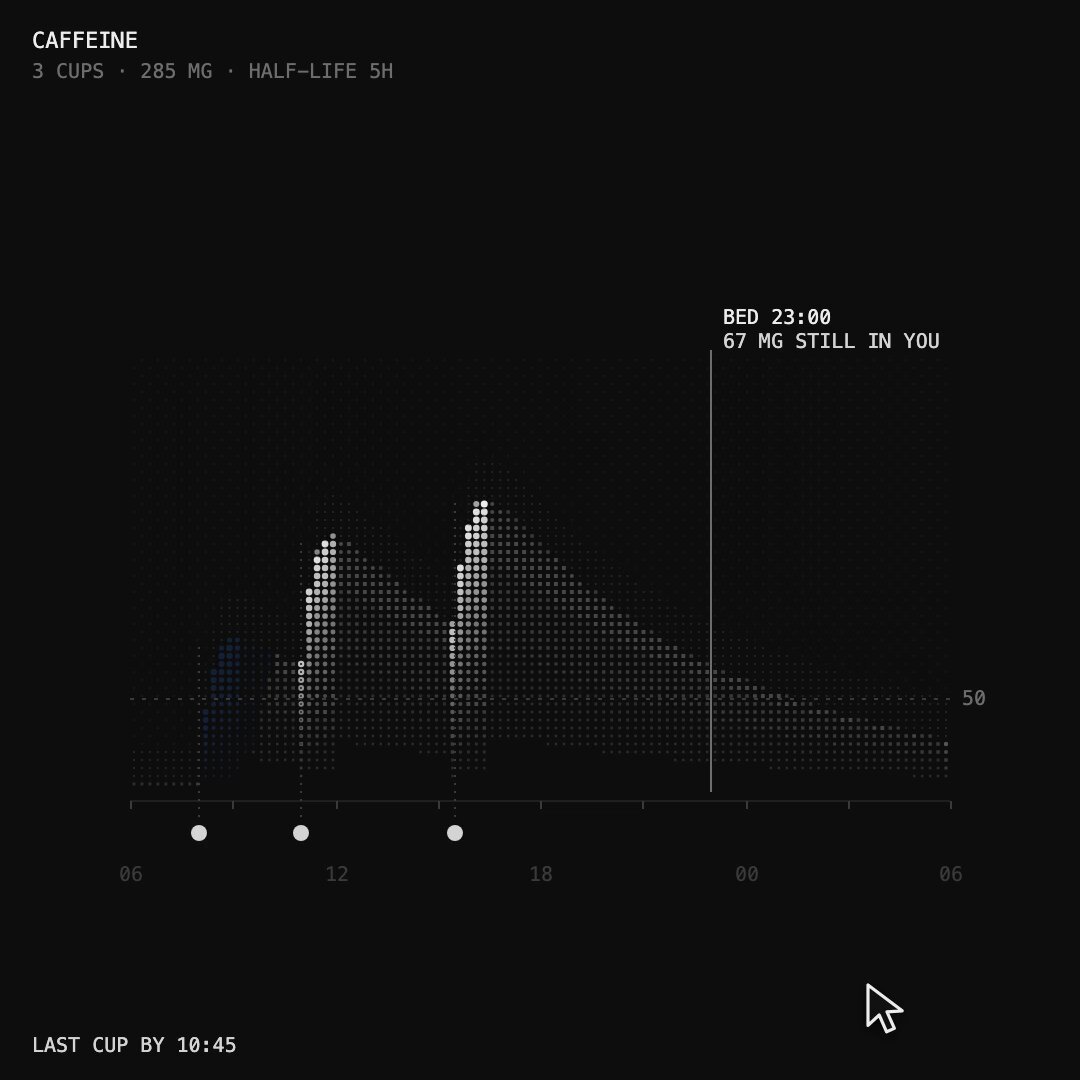
BUILD: Build an interactive daily intake chart with draggable dose markers. Plot cumulative decaying quantities as a quiet field of tiny dots. Moving one marker highlights its contribution in blue and updates total peak and end-of-day annotations. This is an illustrative interface, not medical advice.
DESIGN SYSTEM: Use a near-black #0c0f09 surface with generous empty space. Set labels in an 11px uppercase monospace, white #e6e9df primary and #71756b secondary. The chart is approximately 640 by 330px, with 3px dots on a 6px grid. Active dose and selected time are #406fee. Place a compact summary above, timeline markers below, and thin vertical annotation rules over the plot.
MOTION: Pointer drag maps continuously to time with no queued tween; recompute the dot occupancy and labels at most once per animation frame. Highlight the selected contribution and marker over 120ms, cubic-bezier(0.2,0,0,1). On release, settle the marker and its time label over 180ms using the same curve. Fade annotation changes over 120ms without animating every dot independently. These are implementation targets.
SECTIONS: Summary with dose count and illustrative half-life; dotted cumulative curve; draggable circular dose handles; blue active time label; peak annotation and bedtime reference line; suggested last-dose text. Include idle, dragging and keyboard-selected states.
IMPLEMENTATION: Draw the dot field with Canvas 2D; use React and Motion for the small DOM markers and labels. Use a deterministic exponential-decay function with configurable demonstration parameters, not a clinical recommendation. Provide each dose as an accessible slider with arrow-key time adjustments, visible focus and textual summaries. Respect prefers-reduced-motion by updating values immediately with no settling effects. Limit rendering to a single canvas and cache the dot grid.
ADAPT TO THE PROJECT: Reuse existing tokens, components and fonts; map these colors to the closest project tokens. Never copy original logos, brand names, photos or illustrations; use neutral example data.
SUCCESS CHECK:
- Moving one dose updates the curve, peak and bedtime quantity together.
- Keyboard users can select and move every marker and read the resulting values.
- Reduced motion preserves the information and a narrow viewport keeps time labels legible.