REFERENCE
- Gallery page: https://magpui.com/en/i/chart-scrubber-with-quiet-tooltips-5dbd55
- First frame (image): https://dnioievkvxejjbxgwvko.supabase.co/storage/v1/object/public/media/chart-scrubber-with-quiet-tooltips-5dbd55/shot.jpg
- Clip (mp4): https://dnioievkvxejjbxgwvko.supabase.co/storage/v1/object/public/media/chart-scrubber-with-quiet-tooltips-5dbd55/clip.mp4
- Original post: https://60fps.design/shots/dropset-trends-graph-interaction by Dropset
Before building, download the first frame and look at it. If ffmpeg is available, download the clip and extract frames (ffmpeg -i clip.mp4 -vf fps=2 frame-%02d.png), then study the motion frame by frame. Match what you see; the text below describes it, the frames are the truth.

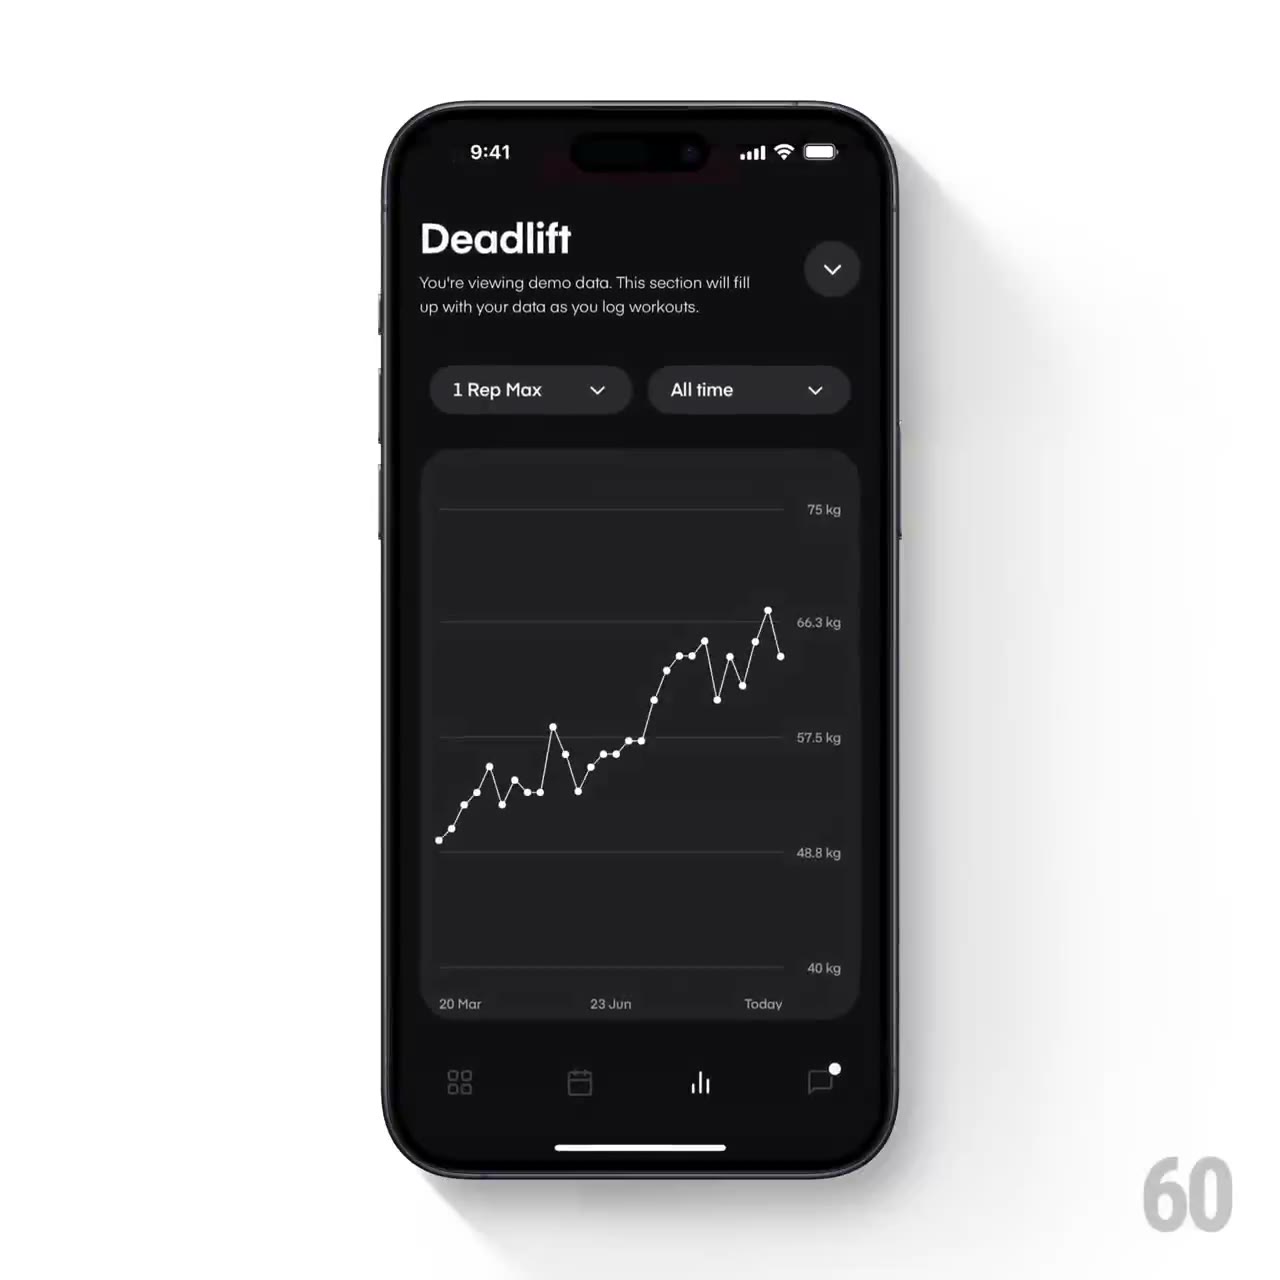
BUILD: Build only a compact historical line-chart card with scrubbing, a selected-point tooltip and two dropdown filters. The resting chart shows a thin white line with small dot markers. While a point is inspected, dim the other marks and show a vertical guide with a single bright dot. Keep the interaction analytical and calm, without camera zooms or a phone mockup.
DESIGN SYSTEM: Use a roughly 350px-wide chart on #202023 with 20px rounded corners and 18px padding, inside a #111113 container. Draw a 1px #E5E5E5 line and 3px circular markers, subtle #38383B grid lines and 10px #99999F axis labels. Place compact metric and date-range dropdown pills above the chart. The tooltip is a #2C2C30 rounded rectangle around 170px by 68px with a 22px white value, 11px unit and 10px muted description/date. Keep margins at least 12px so the tooltip cannot escape the container.
MOTION: On pointer down, hover or keyboard selection, fade nonselected data to roughly 25 percent opacity over 120ms, cubic-bezier(0.2,0,0,1). Move the guide to the nearest data point without elastic overshoot; soften tooltip position changes over an estimated 100ms, cubic-bezier(0.2,0,0,1). On release or exit, restore the full line over 180ms. Dropdown menus fade and translate upward from a 4px offset over 140ms. These are inferred implementation targets.
SECTIONS: Resting chart; inspecting-point state with guide and tooltip; metric selector; date-range selector; open dropdown and empty-data states. The tooltip includes value, unit, metric explanation and date. Filters update the plotted subset and axis bounds while retaining the compact card geometry.
IMPLEMENTATION: Use SVG for the line, dots and guide and Motion for tooltip and opacity transitions. Derive nearest-point selection from the horizontal pointer coordinate and support touch pointer capture without blocking normal page scroll until the user engages. Give the chart a keyboard-focusable inspection mode with ArrowLeft/ArrowRight and a text/table alternative. Implement dropdowns with existing accessible menu primitives. Do not invent health claims or precise measurements; use neutral sample data. Limit rendering to the visible dataset and avoid rebuilding every SVG node on each pointer event. With prefers-reduced-motion, immediately replace chart and tooltip states.
ADAPT TO THE PROJECT: Reuse the project existing design tokens, components and fonts, mapping these colors to the closest tokens. Never copy logos, brand names, photos or illustrations from the original; use placeholder data and labels.
SUCCESS CHECK:
- Scrubbing consistently selects the nearest point and keeps the tooltip inside the card.
- Filters produce matching plotted values, units and axis labels without layout jumps.
- Keyboard, touch and reduced-motion operation expose the same information.