REFERENCE
- Gallery page: https://magpui.com/en/i/agent-session-replayed-as-a-diff-chart-c42e14
- First frame (image): https://dnioievkvxejjbxgwvko.supabase.co/storage/v1/object/public/media/agent-session-replayed-as-a-diff-chart-c42e14/shot.jpg
- Clip (mp4): https://dnioievkvxejjbxgwvko.supabase.co/storage/v1/object/public/media/agent-session-replayed-as-a-diff-chart-c42e14/clip.mp4
- Original post: https://x.com/zzzzshawn/status/2118908341795905841 by @zzzzshawn
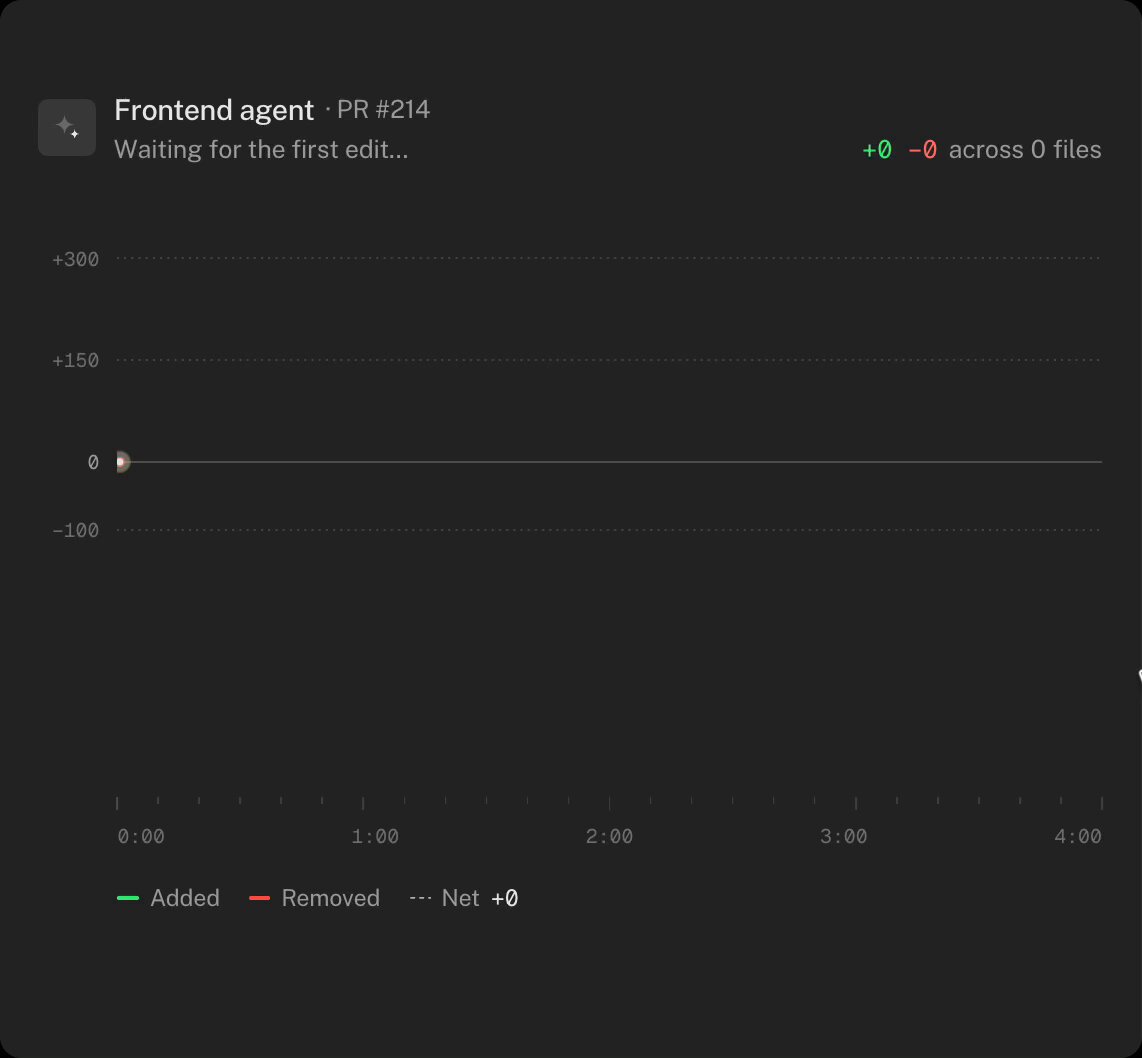
Before building, download the first frame and look at it. If ffmpeg is available, download the clip and extract frames (ffmpeg -i clip.mp4 -vf fps=2 frame-%02d.png), then study the motion frame by frame. Match what you see; the text below describes it, the frames are the truth.

BUILD: A dark, rounded panel component that replays an AI coding agent's session as a diverging diff chart. Cumulative lines added rise above a zero baseline, lines removed drop below it, and a file timeline underneath shows which file the agent was editing at each moment. Everything is driven by a single playhead that sweeps left to right over about 5 seconds, so the chart feels like a live recording of the agent at work, then becomes explorable on hover.

DESIGN SYSTEM: Card background #1a1a1a to #141414, 1px border #262626, radius 16px, padding 24px, max width about 1000px. Header row: a 28px rounded-square agent icon, title 'Frontend agent' in a 14px medium sans in #f5f5f5 followed by a muted '· PR #214' in #737373; below it 'Editing <path>' in 12px sans with the file path in a monospace face, the directory part in #737373 and the file name in #e5e5e5. Right side of the header: '+318' in #4ade80, '−94' in #f87171 and 'across 7 files' in #a3a3a3, all tabular numbers. Chart area about 300px tall with y ticks (+300, +150, 0, −150) in 10px monospace #525252 and a 1px zero baseline #404040. Additions series: 1.5px step line #4ade80; area under it filled with a halftone dot pattern (1.5px dots on a 4px grid, green at 0.35 opacity fading toward the baseline). Deletions series mirrored below with #f87171 and the same dotted fill. A dotted gray 'Net' line runs between them. File timeline below: one row per file, 4px tall rounded bars in #3f3f46 with bright green or red tick marks where edits happened, file names in 11px monospace #a3a3a3 at the bar end. Time axis 0:00 to 4:00 in 10px monospace. Legend at the bottom: Added (green), Removed (red), Net (dotted) with the live net value in white.

MOTION: Playhead: progress 0 to 1 over 5000ms, cubic-bezier(0.45, 0, 0.25, 1), revealing both series through an SVG clipPath whose width follows the playhead. Leading edge: a 6px green dot on the additions line and a red dot on the deletions line, each with a soft 8px blur glow and a 14px ring that pulses (scale 1 to 1.6, opacity 0.6 to 0, 900ms, repeating). Counters in the header and legend tick to the value at the playhead every frame. File name in the 'Editing' line changes when the active file changes, with a scramble: characters resolve left to right from random glyphs over 250ms. File timeline bars grow in sync with the playhead; the active bar brightens to #a3a3a3 and new rows fade and slide in 4px over 200ms when their file first appears. After playback, hovering shows a dashed crosshair snapped to the nearest event with a tooltip (fade + 4px rise, 150ms, cubic-bezier(0.2, 0.8, 0.2, 1)).

SECTIONS: Parts: header (agent, PR label, editing line, totals), chart (axes, baseline, additions area, deletions area, net line, playhead dots), file timeline (rows, bars, edit ticks, labels), time axis, legend. States: idle before play (empty chart, replay button), playing (playhead sweeping), done (full chart, hover enabled), hover (crosshair plus tooltip showing file, time, +/− counts and 3 to 6 syntax-highlighted code lines with green-tinted added and red-tinted removed lines, or 'Binary file added' for images), reduced motion (final state rendered at once).

IMPLEMENTATION: React + TypeScript with plain SVG, no chart library. Keep one data model: an array of events {t, file, additions, deletions, snippet?}; derive the cumulative step series and per-file active spans from it. One requestAnimationFrame clock in a ref feeds the clip width, dots, counters, header file name and timeline so nothing drifts out of sync; Motion is fine for the tooltip and row entrances. Halftone fills with an SVG <pattern> clipped by the area path. Use viewBox plus ResizeObserver for responsiveness. Hover lookup with a binary search on t. Accessibility: role='img' with an aria-label summary, a visually hidden table of events, arrow keys step through events and show the tooltip, visible focus ring. prefers-reduced-motion: no sweep, no scramble, static counters. Keep the SVG under about 2000 nodes; include realistic mock data (about 7 files, 40 events) and a replay button.

ADAPT TO THE PROJECT: Reuse the project's existing design tokens, fonts and components (card, tooltip, buttons); map the greens, reds and grays to the closest existing tokens. Do not copy logos, brand names or product names from the original; use placeholder agent and file names.

SUCCESS CHECK:
- On load the playhead sweeps once and the header counters, file name and timeline bars all match the chart at every frame.
- After playback, hovering or using arrow keys snaps to events and shows a tooltip with highlighted code lines.
- With prefers-reduced-motion on, the final chart renders instantly with no animation.