REFERENCE
- Gallery page: https://magpui.com/en/i/dithered-monospace-heatmap-charts-f3e2be
- First frame (image): https://dnioievkvxejjbxgwvko.supabase.co/storage/v1/object/public/media/dithered-monospace-heatmap-charts-f3e2be/shot.jpg
- Clip (mp4): https://dnioievkvxejjbxgwvko.supabase.co/storage/v1/object/public/media/dithered-monospace-heatmap-charts-f3e2be/clip.mp4
- Original post: https://x.com/alextraykov/status/2116154670859334001 by @alextraykov
Before building, download the first frame and look at it. If ffmpeg is available, download the clip and extract frames (ffmpeg -i clip.mp4 -vf fps=2 frame-%02d.png), then study the motion frame by frame. Match what you see; the text below describes it, the frames are the truth.

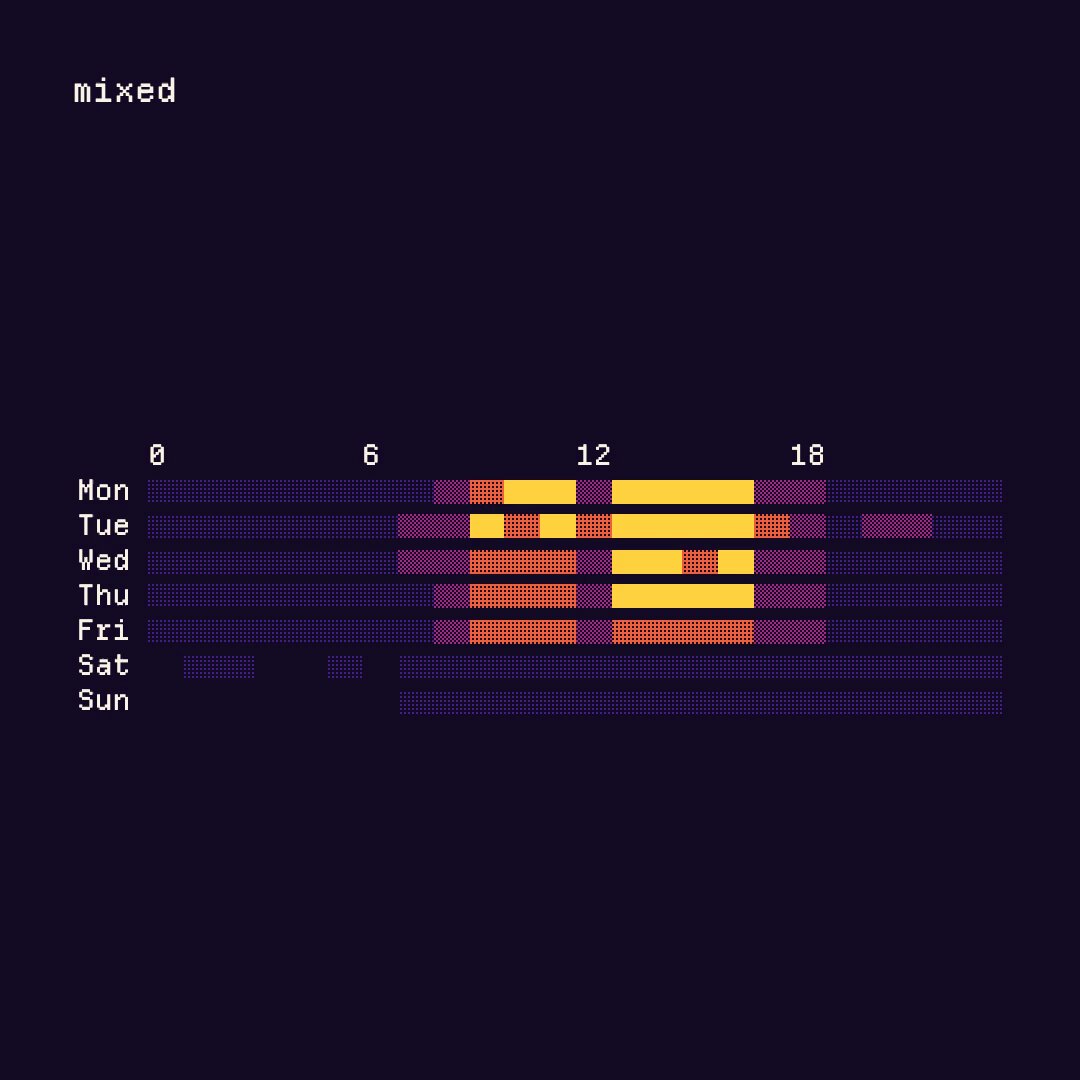
BUILD: Build a small set of text-mode data charts drawn only with monospace block and dither characters on a near-black canvas: a weekly heatmap (rows Mon to Sun, columns hours 0 to 23), a gantt-style timeline, diverging agree/disagree bars, a cohort retention grid and small sparkline cells in a table. Each chart can be re-themed live between color palettes, and the same data also renders in a terminal window. It should feel precise, retro and a little hacker-ish, with density shown by dither pattern as much as by color.

DESIGN SYSTEM: Page background #0d0d0d (alternate theme backgrounds: deep violet #120a24, deep green #0c1a14). One monospace typeface at about 14-16px with a 1.1 line height, labels in off-white #eaeaea, axis ticks in 60% white, a small lowercase theme label at the top-left of each chart (about 14px). Each chart sits centered with about 80px of padding and no borders or cards. Bar and cell fills are built from characters: empty (no glyph), light dither (about 25% density), medium dither (about 50%), dense dither (about 75%) and solid block, so value intensity is readable even in grayscale. Themes: one hue (greens #1f5f3f to #6fe0a0), mixed (violet #4a2a8a, magenta #a8408a, orange #e8643c, amber #ffd23f), paper (black ink on #f3f1ea), phosphor (pale green on near-black), gilt (amber #e0b23a on black), christmas (dark red #5a1a1a to bright red #e04040 on dark green). Heatmap cells are one character wide with 0 gap and rows 22px high with 3px gaps. A terminal-style frame variant: 1px gray (#666) outline with a small legend title in the border, a prompt line starting with a dollar sign, and a table of colored swatches with contrast ratios and pass/fail marks (pass in green, fail in red-orange).

MOTION: (1) Chart change: the current chart fades out in 150ms and the next fades in in 250ms with ease-out, cells appear left to right with a 6-10ms stagger per column so the dither seems to scan in. (2) Theme change: colors cross-fade in 400ms while the dither pattern stays fixed. (3) Terminal view: the command line types out at about 40 characters per second, then the table prints row by row at 60ms per row. (4) Slides hold for about 2 seconds each when auto-playing.

SECTIONS: Chart title label, chart body (axis row on top for the heatmap, row labels on the left), optional legend or caption line (such as a one-line takeaway under a grid), terminal frame variant. States: idle, theme switching, loading (cells scanning in), pass/fail annotation.

IMPLEMENTATION: Render to a plain monospace text grid, either as pre-formatted text with colored spans or a canvas that draws glyphs on a fixed cell grid (cell about 9px by 18px), using the Unicode block and shade characters (light, medium, dark shade and full block). Keep the data as JSON and map value to glyph density via thresholds. Provide a text fallback with aria-labels and a data table for screen readers. prefers-reduced-motion: no stagger or typing, instant swaps. Colors as CSS variables so themes switch with one class. Performance: under 3000 characters per chart, no layout thrash, devicePixelRatio aware canvas.

ADAPT TO THE PROJECT: Reuse the project's existing design tokens, components and fonts; map colors to the closest existing tokens; never copy logos, brand names, photos or illustrations from the original; use placeholder data.

SUCCESS CHECK:
- Every value is distinguishable by dither density alone when the colors are removed.
- Switching themes changes only colors, never the layout or glyph positions.
- The same data renders in both the web view and a terminal-style frame, and screen readers get a real data table.