REFERENCE
- Gallery page: https://magpui.com/en/i/contour-map-with-data-cursor-fb60af
- First frame (image): https://dnioievkvxejjbxgwvko.supabase.co/storage/v1/object/public/media/contour-map-with-data-cursor-fb60af/shot.jpg
- Clip (mp4): https://dnioievkvxejjbxgwvko.supabase.co/storage/v1/object/public/media/contour-map-with-data-cursor-fb60af/clip.mp4
- Original post: https://x.com/nicforey/status/2119850582907535604 by @nicforey
Before building, download the first frame and look at it. If ffmpeg is available, download the clip and extract frames (ffmpeg -i clip.mp4 -vf fps=2 frame-%02d.png), then study the motion frame by frame. Match what you see; the text below describes it, the frames are the truth.

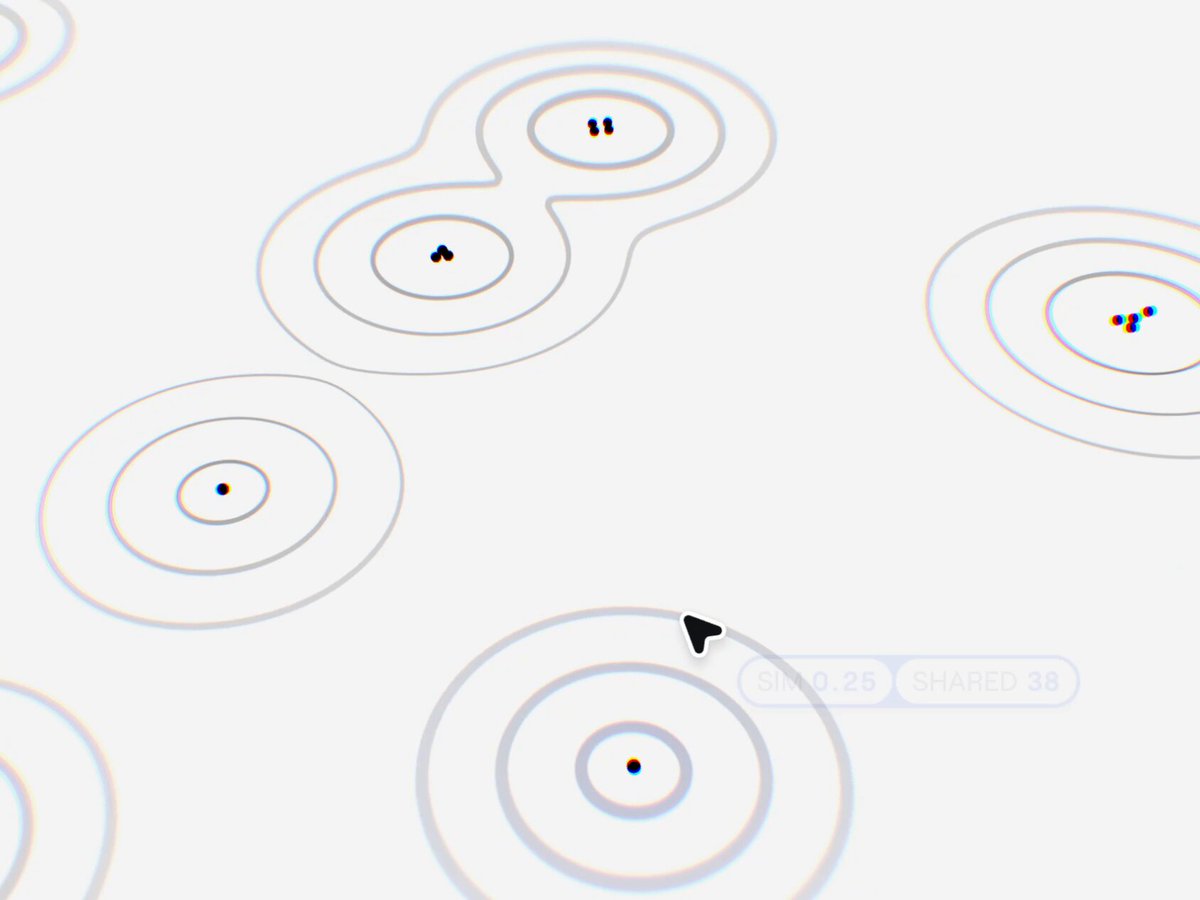
BUILD: Build a focused interactive cluster-map visualization. Small black nodes sit inside nested, irregular contour rings. Hovering a cluster quietly highlights its contours and reveals a tiny, blue-outlined data capsule next to the pointer. Selecting a node reveals its identifier and two metrics. This is a data exploration surface, not a geographic map or full dashboard.
DESIGN SYSTEM: Use an off-white #F7F7F5 canvas, 1px gray #C8CBC8 contour strokes, black #171917 nodes about 4px wide and blue #2478FA active details. Draw 2-4 nested smooth organic contours around each node group with generous empty space between clusters. Capsule labels use a neutral sans-serif around 10-12px; numeric values are blue and slightly stronger. Capsules are white, thin blue outlined, about 20px tall with fully rounded ends. Selected nodes show a small blue circular plus with white stroke.
MOTION: On pointer entry, tint the relevant contours blue and softly strengthen the inner rings over 150ms, cubic-bezier(0.22,1,0.36,1). Reveal a cursor-adjacent capsule with opacity and 3px translation over 120ms using the same easing; it follows pointer position without elastic lag. On node activation, replace the cluster summary with an identifier capsule and two adjacent numeric pills over 140ms. Clear the previous highlight on exit over 120ms. Durations are recommended recreation targets.
SECTIONS: Idle contour field; cluster hover showing SIM and SHARED values; active node showing identifier and two metrics; focus and dismissed states. Use clearly labeled synthetic data rather than asserting clinical validity.
IMPLEMENTATION: Use SVG paths and circles for a modest dataset, with React state and Motion only for highlight/tooltip presence. Map pointer coordinates into SVG viewBox space and render capsules in an overlay clamped to the map edges. Ensure nodes have enlarged hit targets, keyboard focus and accessible data summaries; Enter selects and Escape clears. On touch, tap selects instead of depending on hover. Under prefers-reduced-motion, update directly without translation. Avoid a full SVG re-render on every pointer event and use requestAnimationFrame for pointer position updates.
ADAPT TO THE PROJECT: Reuse the existing tokens, components and fonts. Map these estimated colors to nearby project tokens. Do not copy source logos, brand names, photos or illustrations; use placeholders.
SUCCESS CHECK:
- Only the hovered cluster highlights and its capsule displays the matching data.
- The identifier and metric pills remain readable at canvas edges.
- Keyboard and touch can reach the same information without a custom cursor.